


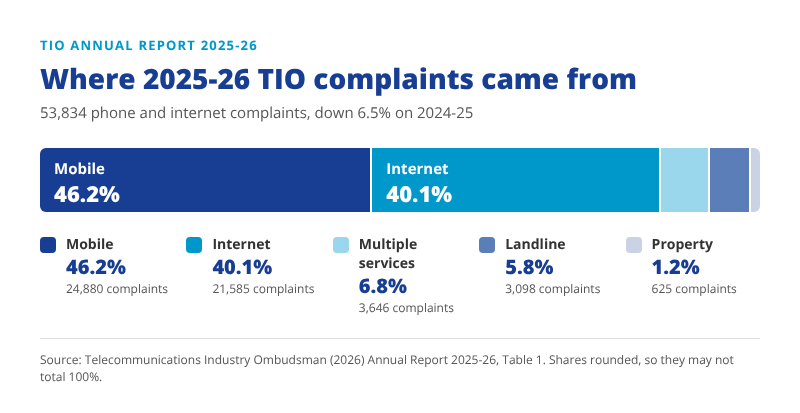
- The TIO received 53,834 phone and internet complaints in 2025-26, down 6.5% on 2024-25. Internet services made up 21,585 of them (40.1%), down 7.1% (TIO 2026).
- Waiting for a provider to act (33,165 complaints) and service and equipment fees (19,771) were again the top issues. Inadequate fault testing rose 10.8% to 7,143 (TIO 2026).
- Complaints made directly to telcos fell 10.8% to 748,501, but 6.9% were escalated to the TIO, up from 6.6% the year before (ACMA 2026a).

The Telecommunications Industry Ombudsman (TIO) received 53,834 phone and internet complaints in 2025-26, 6.5% fewer than the year before. That's the good news.
Complaints about faults that weren't properly tested, new services that took too long to connect, and claims for compensation all went up. And that's the not-so-good news.
Truthfully, no one wants to have to make a complaint about anything, least of all Telecommunications Ombudsman complaints. However, if we don't complain when a service is lacking, improvements won't be made.
Below we break down what the TIO and the ACMA found, which providers attract the most complaints once you allow for size, and how to use the numbers when you choose your next nbn® plan. You deserve the best from your nbn® network connection.
- TIO complaints 2025-26 at a glance
- Top internet complaint issues in 2025-26
- Which telcos get the most TIO complaints?
- nbn® complaints per 10,000 services by provider
- How to read telco complaint data
- What the nbn® network data shows
- Telco complaints by state and region
- Small business telco complaints
- Financial hardship and new consumer protections
- When to take a complaint to the TIO
- Using complaint data to choose an nbn® provider
- Your questions answered
TIO complaints 2025-26 at a glance
TIO complaints fell across every service type in 2025-26. Mobile stayed the most complained-about service, with internet close behind (TIO 2026).
| Measure | 2025-26 | Change on 2024-25 |
|---|---|---|
| Total complaints | 53,834 | Down 6.5% |
| Mobile | 24,880 | Down 3.5% |
| Internet | 21,585 | Down 7.1% |
| Landline | 3,098 | Down 21.2% |
| Property (infrastructure on or near your property) | 625 | Down 1.3% |
| People who came back because their provider didn't fix it | 14,953 | Down 8.1% |
| Small business complaints | 5,581 | Down 11.7% |
| Total contacts to the TIO (online and phone) | 162,885 | Not reported |
Source: TIO (2026) Annual Report 2025-26. Figures as at 7 July 2026.
Internet complaints made up 40.1% of the total, about the same share as the year before.
The Australian Telecommunications Alliance, the industry body for telcos, says TIO complaints are down 68% since 2018 and at their lowest level in two decades (ATA 2026).
The TIO itself says complaints are getting more complex, and some people waited longer than they should have for its specialist teams this year (TIO 2026).
Top internet complaint issues in 2025-26
Waiting for a provider to act is still the biggest internet gripe, coming up in 62.1% of internet complaints. One complaint can raise more than one issue, so the shares below add up to more than 100% (TIO 2026).
| Internet complaint issue | 2025-26 | Share of internet complaints | Change on 2024-25 |
|---|---|---|---|
| No or delayed action by provider | 13,397 | 62.1% | Down 5.3% |
| Service and equipment fees | 8,663 | 40.1% | Down 4.3% |
| Inadequate fault testing | 3,928 | 18.2% | Up 3.3% |
| Intermittent service or dropouts | 3,909 | 18.1% | Down 12.4% |
| No phone or internet service | 3,511 | 16.3% | Down 7.4% |
| Slow data speed | 3,128 | 14.5% | Up 0.3% |
| Delay establishing a service | 2,857 | 13.2% | Up 9.4% |
| Failure to cancel a service | 2,251 | 10.4% | Down 13.8% |
| Non-financial loss (compensation for stress, time or inconvenience) | 2,096 | 9.7% | Up 12.9% |
| Resolution agreed but not met | 1,229 | 5.7% | Down 20.3% |
Source: TIO (2026) Annual Report 2025-26, Table 4.
Which telcos get the most TIO complaints?
Four of the top 10 internet issues grew. Outside the top 10, a few smaller issues jumped:
- Delay establishing a service rose 9.4%. If you're moving or connecting for the first time, check how long an nbn® connection should take so you know when to chase it
- Non-financial loss rose 12.9%. These are people asking for compensation for the time and stress a problem cost them
- Slow data speed held steady at 3,128 complaints. Many speed problems start at home, so rule out the common causes of slow nbn® speeds before you call
- Network outage complaints rose 19.5% to 716. You can check for nbn® outages in your area before you spend time on hold
- Unfair contract term complaints more than doubled, from 101 to 228
- Bill unclear or not received complaints rose 27.2% to 805
One case in the report shows how a connection delay plays out. A customer waited more than six weeks for his new home internet, even though he'd finished the work his provider asked for within three days. His provider hadn't updated its records and didn't answer his emails or voicemails. The TIO found the provider responsible and awarded compensation for the stress and inconvenience (TIO 2026).
Some issues improved. Resolution agreed but not met fell 20.3%, failure to cancel a service fell 13.8% and drop-outs fell 12.4%.
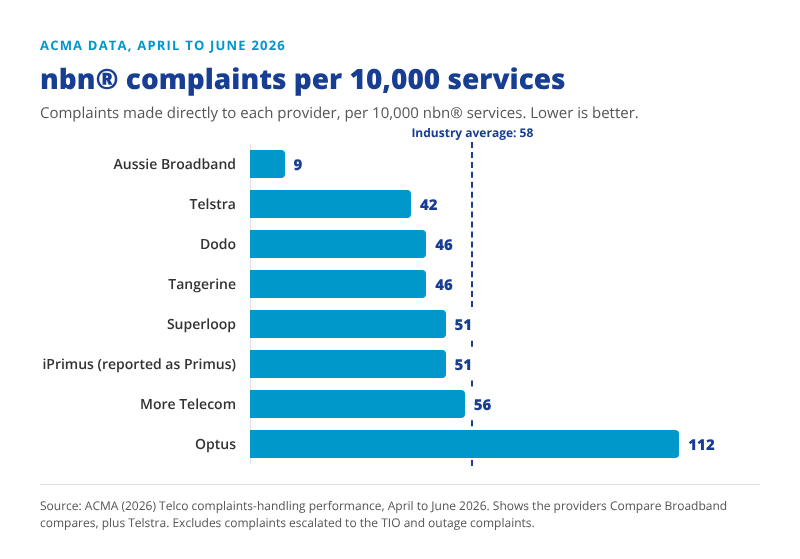
nbn® complaints per 10,000 services by provider
Telstra complaints and Optus complaints were at the forefront with the TIO. This is mainly because they have the most customers. Together they made up 57% of all complaints in 2025-26, and both had fewer complaints than the year before (TIO 2026).
| Provider |
nbn® complaints per 10,000 services (Apr-Jun 26) |
Previous quarter (Jan-Mar 26) |
Average days to resolve (all services) | Share escalated to the TIO (all services) |
|---|---|---|---|---|
| Aussie Broadband | 9 | 9 | 7 | 20.4% |
| Telstra | 42 | 44 | 6 | 8.8% |
| Dodo | 46 | 60 | 2 | 9.5% |
| Tangerine | 46 | 21 | 5 | 24.4% |
| Superloop | 51 | 44 | 5 | 24.4% |
| iPrimus (reported as Primus) | 51 | 48 | 4 | 10.3% |
| More Telecom | 56 | 19 | 5 | 18.2% |
| Optus | 112 | 104 | 5 | 4.1% |
| Industry average | 58 | 61 | 4.7 | 6.6% |
Source: TIO (2026) Annual Report 2025-26, Table 10. These are the providers in the TIO's top 10 that Compare Broadband compares, plus Telstra. The full top 10 is in the TIO report.
Superloop complaints almost doubled, and 92.8% were about internet services. The TIO linked the rise mainly to disputes over Superloop enforcing a 30-day cancellation notice period
Before you leave any provider, check its cancellation notice period in the Critical Information Summary so you don't pay for a month you didn't plan on. Our guide to switching nbn® providers walks through the order of steps
Telstra's complaints fell by 3,347, the biggest drop in the TIO's top 10. We don't compare Telstra plans, but if you're with Telstra and want to see what else is available at your address, call us on 1300 764 000
A raw count doesn't tell you much on its own. A provider with millions of customers will always get more complaints than one with a few hundred thousand. The ACMA's complaint rates, below, are the fairer comparison.
Want to see which of these providers service your home? Check the plans available at your address. Comparing is free, and prices are the same as going direct to the provider.
How to read telco complaint data
Complaint numbers are useful, but they are easy to misread. Keep these points in mind:
- Use rates, not totals. Big providers always have more complaints due to size. Complaints per 10,000 services evens that out
- Look at more than one quarter. A rate can jump when a provider changes its systems or policies, then settle again
- Compare like with like. The ACMA reports nbn®, mobile and other services separately. More Telecom, for example, logged 56 nbn® complaints per 10,000 services but only 13 for mobile
- Know what is left out. The ACMA figures exclude outage complaints and complaints escalated to the TIO
- Some brands report together. Telstra's figures include some of its other brands, so the number covers more than one name
Pair the data with reviews. Complaint rates show how often things go wrong. Reviews on Google Reviews, Trustpilot and ProductReview show how people felt about the fix
What the nbn® network data shows
NBN Co's own figures show the wholesale network meeting most of its targets. That puts more weight on how your provider handles a fault once you report it (NBN Co 2026).
In August 2026, NBN Co reported:
- The nbn® access network was available 99.93% of the time
- An average of 0.4 in every 100 homes and businesses had a network fault that month
- 93% of accepted faults were fixed within target time frames
- 99% of homes and businesses were connected within the agreed time frames
- 89% had their nbn® equipment installed right the first time, up from 88% a year earlier
So why are complaints about fault testing and connection delays rising? The TIO commissioned an independent review of 9,000 complaints. It found much of the delay comes from waiting on information and responses from providers. It also found big differences between providers: some engage early, while others are slower or give incomplete answers (TIO 2026).
If your connection drops out, first work out whether it's an outage or a problem at home. It gives your provider less room to send you round in circles.
Telco complaints by state and region
Victoria had the highest complaint rate in 2025-26, at 2.4 complaints per 1,000 people. NSW had the most complaints in total (TIO 2026).
| State/territory | TIO complaints 2025-26 | Complaints per 1,000 people |
|---|---|---|
| Victoria | 15,372 | 2.4 |
| South Australia | 4,008 | 2.3 |
| New South Wales | 16,827 | 2.1 |
| Queensland | 9,932 | 2.0 |
| Australian Capital Territory | 805 | 1.8 |
| Western Australia | 4,560 | 1.7 |
| Tasmania | 865 | 1.6 |
| Northern Territory | 313 | 1.5 |
Source: TIO (2026) Annual Report 2025-26, Figure 4.
- The council areas with the most complaints were Brisbane (2,303), Gold Coast (1,270), Moreton Bay (1,019), Wyndham (814) and Sunshine Coast (783)
- Wyndham, in Melbourne's west, had the highest rate per 1,000 people of those five. If you're in Melbourne, you can compare home internet plans in Melbourne
- Four of the top five council areas are in south-east Queensland. Brisbane households can compare internet plans in Brisbane
- Complaints from major cities fell only 1.7% to 39,391. Inadequate fault testing (up 17.9%), delays establishing a service (up 15.1%) and slow data speed (up 12.3%) all rose in the cities
- Regional complaints fell 17.1% to 11,678, and complaints about poor mobile coverage in regional areas fell 30.5%. Townsville (334), Cairns (282), Mid-Coast (255), Greater Bendigo (238) and Toowoomba (237) logged the most regional complaints
Small business telco complaints
Small businesses made 5,581 complaints to the TIO in 2025-26, down 11.7%. Their top three issues didn't change: no or delayed action by the provider (3,483), service and equipment fees (1,958) and business loss (1,001) (TIO 2026).
- Slow data speed was the fastest-growing small business issue, up 10.3% to 354 complaints
- No phone or internet service fell 18.4% to 795 complaints
- Outside the top 10, unclear or missing bills rose 50.2% to 335
Compare Broadband doesn't sell business nbn® plans. We can set up a small business on a residential plan, and we'll tell you clearly that the plan is for residential use. See our guide to business nbn® plans and small business internet to work out whether a residential plan suits your business.
Financial hardship and new consumer protections
The TIO received 1,989 financial hardship complaints in 2025-26, down 3.7%. Most (70.3%) were about mobile services (TIO 2026). Internet hardship complaints peaked at 142 in April to June 2026, the highest of the four quarters.
If you can't pay a phone or internet bill on time, tell your provider early and use the words "financial hardship". Under ACMA rules, your telco must (ACMA 2026d):
- Offer at least six ways to help, including putting off the due date and a payment plan you can afford
- Focus on keeping you connected
- Assess your application within 5 business days and tell you the outcome within 2 business days
- Treat your complaint as urgent if it relates to your hardship or a disconnection is about to happen
For free financial counselling, call the National Debt Helpline on 1800 007 007.
New telco consumer protection rules
The ACMA released a draft Telecommunications (Consumer Protections) Industry Standard on 29 September 2026. It will replace the current industry code with rules the ACMA can enforce directly (ACMA 2026c). Proposed protections include:
- Clearer information before a sale
- Guardrails on sales incentive schemes
- Stronger credit assessments
- Better information and remedies for mobile coverage
- Support for consumers experiencing vulnerability
- More flexible payment options
- Protection against unfair or mistaken disconnection
Submissions close on 10 November 2026. The ACMA says it will use complaint trends to measure the impact once the new Standard is in place (ACMA 2026a).
When to take a complaint to the TIO
Take your complaint to the TIO when you've given your provider a fair chance to fix it and it still isn't sorted. The TIO is free and independent of the telcos.
Here is how the TIO process works (TIO 2026):
- The TIO sends your complaint to your provider first. Most complaints are resolved within 10 days by agreement with the telco
- If it's still not fixed, you can return to the TIO and a complaint specialist works on it with you and the provider
- If you can't agree, the TIO can give its view on a fair outcome
- A specialist decision maker can make a final decision. If you accept it, your provider must follow it
In 2025-26, 14,953 people went back to the TIO because their provider still hadn't fixed the problem, 8.1% fewer than the year before. Our step-by-step guide to complaining about your internet provider covers what to say and what to keep a record of.
The TIO can't help with problems with social media, email or other digital platforms. In 2025-26, 1,124 people came to it about digital platform problems, up 70%. The TIO is asking the government to expand its role to cover them (TIO 2026).
Using complaint data to choose an nbn® provider
Use complaint data as one check alongside speed, price and reviews. It tells you how often things go wrong and how well a provider deals with it. Before you sign up:
- Check the provider's nbn® complaint rate in the latest ACMA quarter, not just its total TIO complaints
- Look at the trend across two or three quarters
- See how quickly it resolves complaints and how many end up at the TIO
- Read recent reviews across more than one platform
- Check the cancellation notice period in the Critical Information Summary
When you're ready, compare nbn® plans from the providers that service your address. Comparing is free. Prices are the same as going direct to the provider, and there are no mark-ups or additional fees.
Your questions answered
How many complaints did the TIO receive in 2025-26?
The TIO received 53,834 phone and internet complaints in 2025-26, down 6.5% on the year before. Mobile accounted for 24,880 and internet for 21,585.
What do Australians complain about most?
No or delayed action by a provider. It came up in 33,165 complaints, or 61.6% of the total. Service and equipment fees were second, at 19,771.
Which nbn® provider has the fewest complaints?
Of the providers Compare Broadband compares, Aussie Broadband had the lowest nbn® complaint rate in April to June 2026: 9 per 10,000 services, against an industry average of 58 (ACMA 2026b). You can compare Aussie Broadband nbn® plans at your address.
Does a high number of TIO complaints mean a provider is bad?
Not on its own. Bigger providers get more complaints because they have more customers. Complaints per 10,000 services, published by the ACMA every quarter, is a fairer comparison.
Is the TIO free?
Yes. The TIO is free and independent. Contact your provider first and give it a chance to fix the problem. If it doesn't, contact the TIO on 1800 062 058 or online.
How often is telco complaint data released?
The TIO publishes its annual report each October and quarterly updates through the year. The ACMA publishes telco complaint rankings every quarter. We update this page when new figures come out.
 |
Hayley Griffin Content Lead Hayley draws on over ten years of experience in technology, internet, and communications fields. Her experience spans across global clients, offering expertise on about the nbn, internet plans and hardware challenges facing Australian households, businesses and consumers. Read full bio |
References
- ACMA (2026a) Telco complaints down but ombudsman referrals still too high. Australian Communications and Media Authority, 7 October. https://www.acma.gov.au/articles/2026-10/telco-complaints-down-ombudsman-referrals-still-too-high
- ACMA (2026b) Telco complaints-handling performance, April to June 2026. Australian Communications and Media Authority. https://www.acma.gov.au/publications/2022-10/report/telco-complaints-handling-performance
- ACMA (2026c) Have your say on stronger protections for telco consumers. Australian Communications and Media Authority, 29 September. https://www.acma.gov.au/articles/2026-09/have-your-say-stronger-protections-telco-consumers
- ACMA (2026d) Help if you can't pay your bill. Australian Communications and Media Authority. https://www.acma.gov.au/help-if-you-cant-pay-your-bill
- ATA (2026) Telco complaints at lowest level in decades according to latest data. Australian Telecommunications Alliance, 7 October. https://www.austelco.org.au/telco-complaints-at-lowest-level-in-decades-according-to-latest-data/
- NBN Co (2026) How we're tracking: August 2026. NBN Co. https://www.nbnco.com.au/corporate-information/about-nbn-co/updates/dashboard-august-2026
- Telecommunications Industry Ombudsman (2026) Annual Report 2025-26: Meeting challenge with intent. TIO, 7 October. https://www.tio.com.au/data-and-reports/annual-report-2025-26
 Loading...